 Fayad K. Hassan

Open source intelligence lives or dies on context, and context is usually the first thing the tools destroy. Each source sits in its own silo: one tab for social posts, another for code, another for paste sites. Storytime is my attempt at the opposite. It ingests signals from several platforms and lays them on one interactive timeline, so a trail that was scattered across places and days reads as a single sequence.
What it pulls together
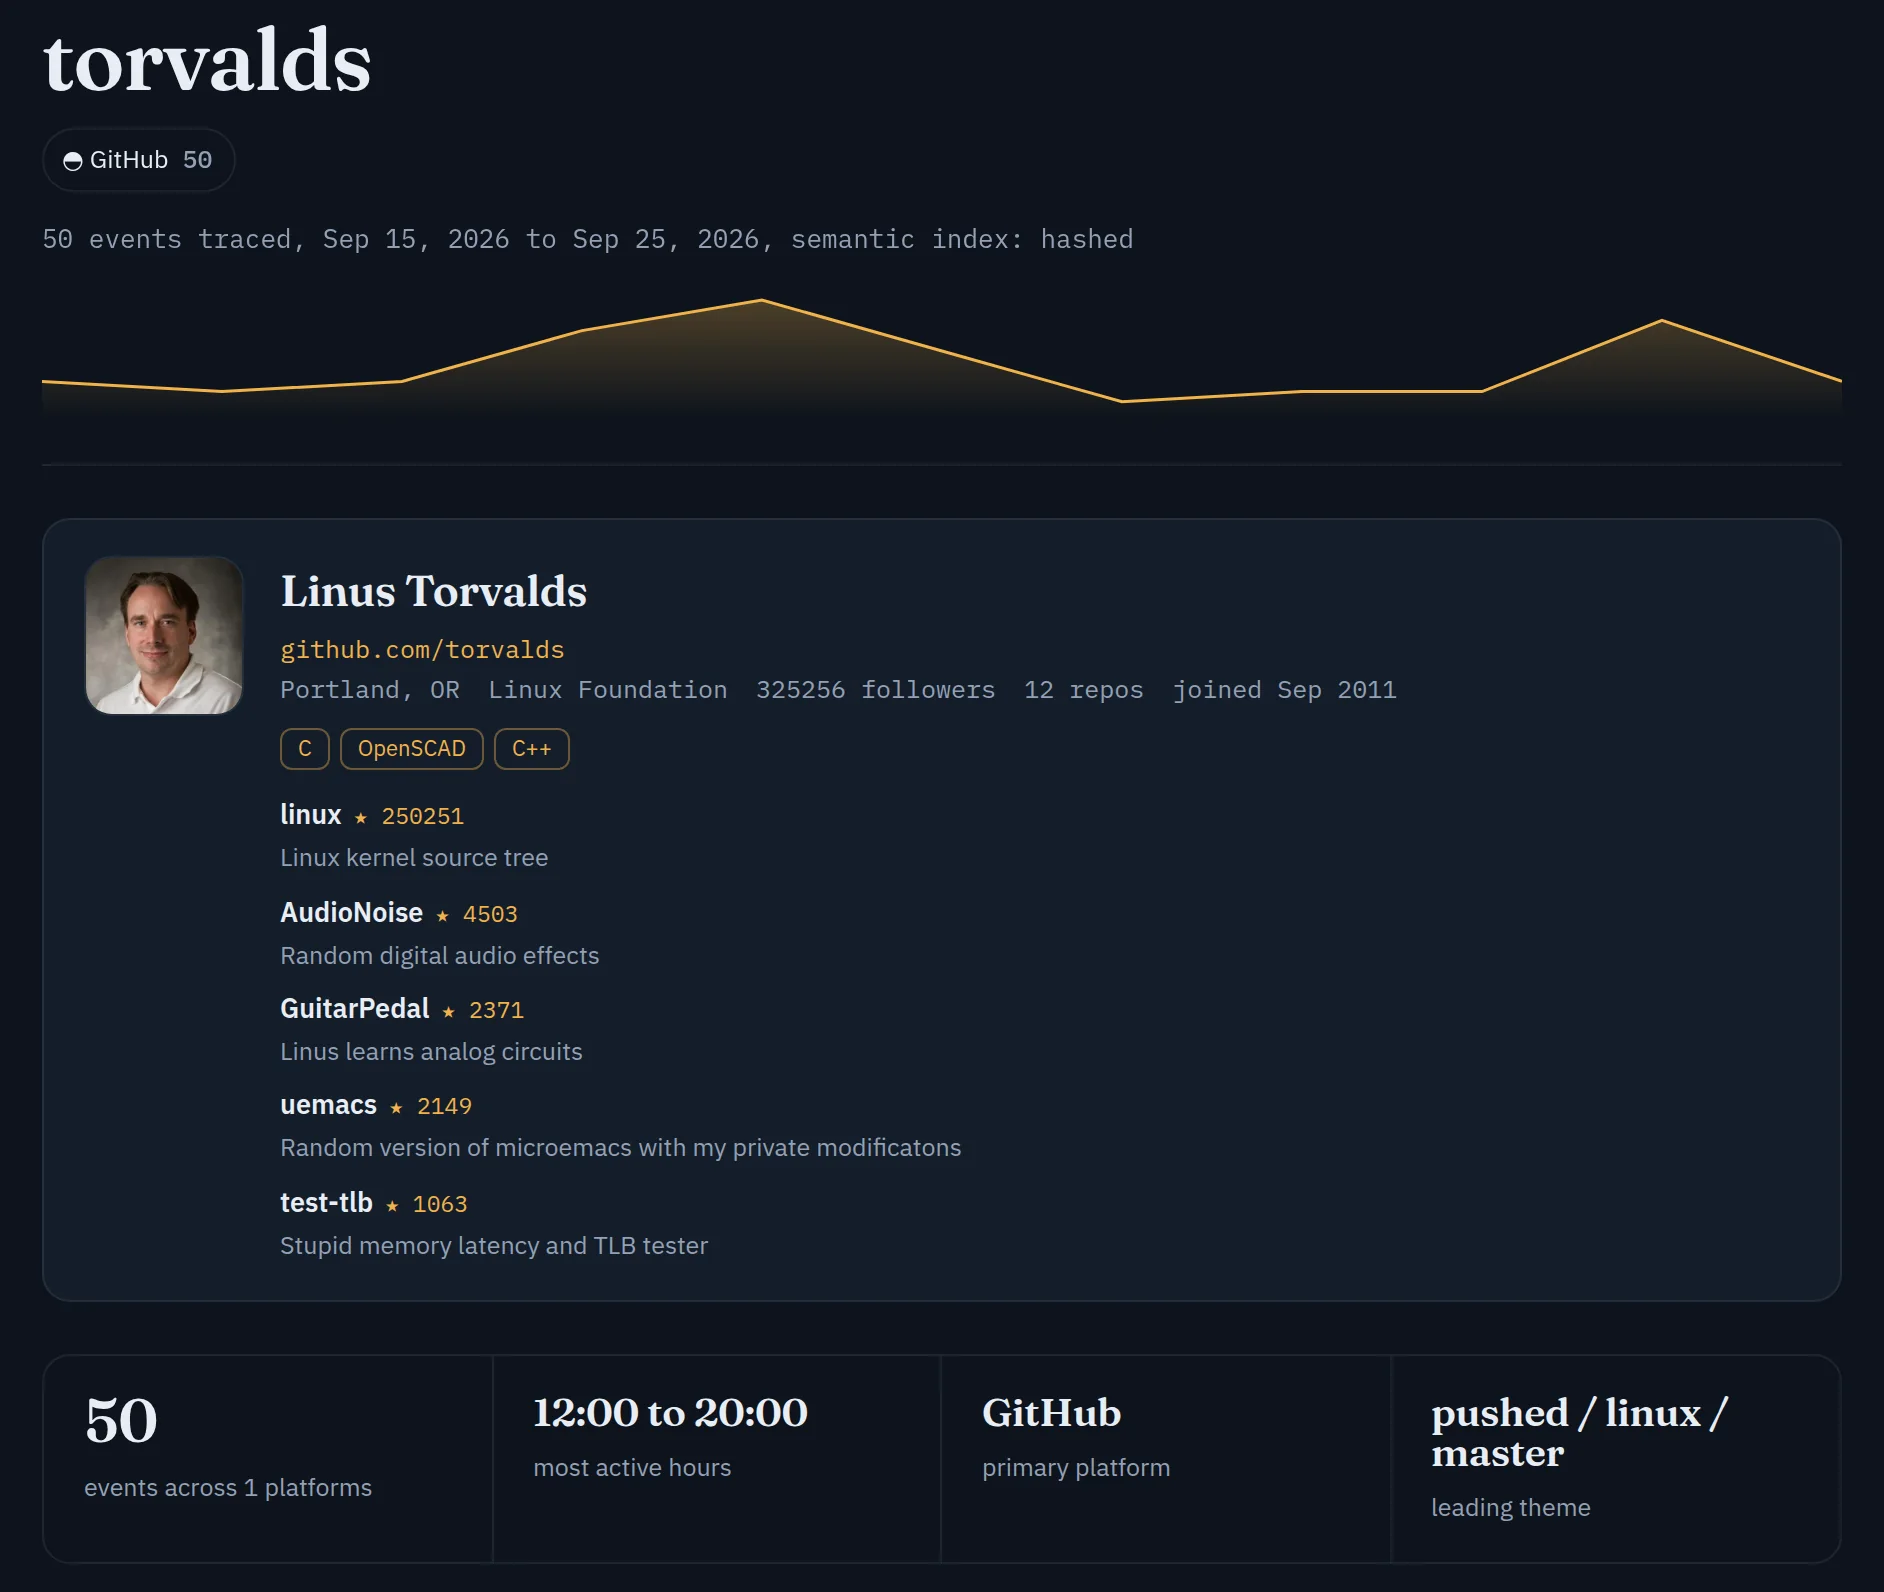
It ingests and normalises material from social posts, public code repositories and their commits, forum threads, RSS newsfeeds, and paste sites, then places every item on a shared timeline. The value is not any single feed. It is seeing them interleaved: the teaser post, the commit that follows it, the paste that follows that, and the news report that confirms it, laid out in the order they happened rather than in five separate windows.
What it is built for
Chronology first. When events from different platforms sit on the same axis, a pattern that no single source shows becomes obvious. Correlation next: the same handle or keyword surfacing across platforms is one click, not an afternoon of tab switching. And fast narrowing: a date range or a keyword filter collapses a month of noise down to the window that matters.
An illustrative case
This is a hypothetical, drawn to show the shape of the work rather than a real investigation. Picture an account hinting at an upcoming data drop. A day later a public repository appears carrying an extraction script. A day after that, credentials surface on a paste site. A day after that, a security blog reports a breach at a finance firm. Each fragment on its own is thin. On one timeline the sequence is legible at a glance: announcement, then tooling, then leak, then public confirmation. Reconstructing that order is most of the analytical work, and it is exactly the part a timeline does for you.
Status
Version 2.1, released in September 2026, is a full rebuild. Beyond the timeline it runs sixteen connectors over infrastructure, public records, places and usernames, and a local agent investigates across them, citing the evidence for every finding and flagging court and sanctions matches for a person to review. It needs no paid API key and runs from one Docker image, docker run -p 3000:3000 ghcr.io/elfayadk/storytime:latest. The repository is public under the MIT licence, and An OSINT Tool Should Show Its Working walks through it on live data.
Normalising the sources is the hard part
The hard part of this kind of tool is never the visualisation. It is normalising messy, inconsistent sources into events that can honestly share one axis, and being clear about what each source did and did not capture. Build that layer carefully, because a timeline that quietly misaligns two sources is more dangerous than no timeline at all.